Your app revenue, on the record.
Paste a Shopify Partner API token and pick your apps. ShopAppDB Stats keeps MRR, churn, cohorts, earnings and a timeline for every merchant in one ledger, built from Shopify’s own records. Nothing to install in your app.
Free for one app under $5K MRR. No credit card. Every report and CSV export, on every plan.
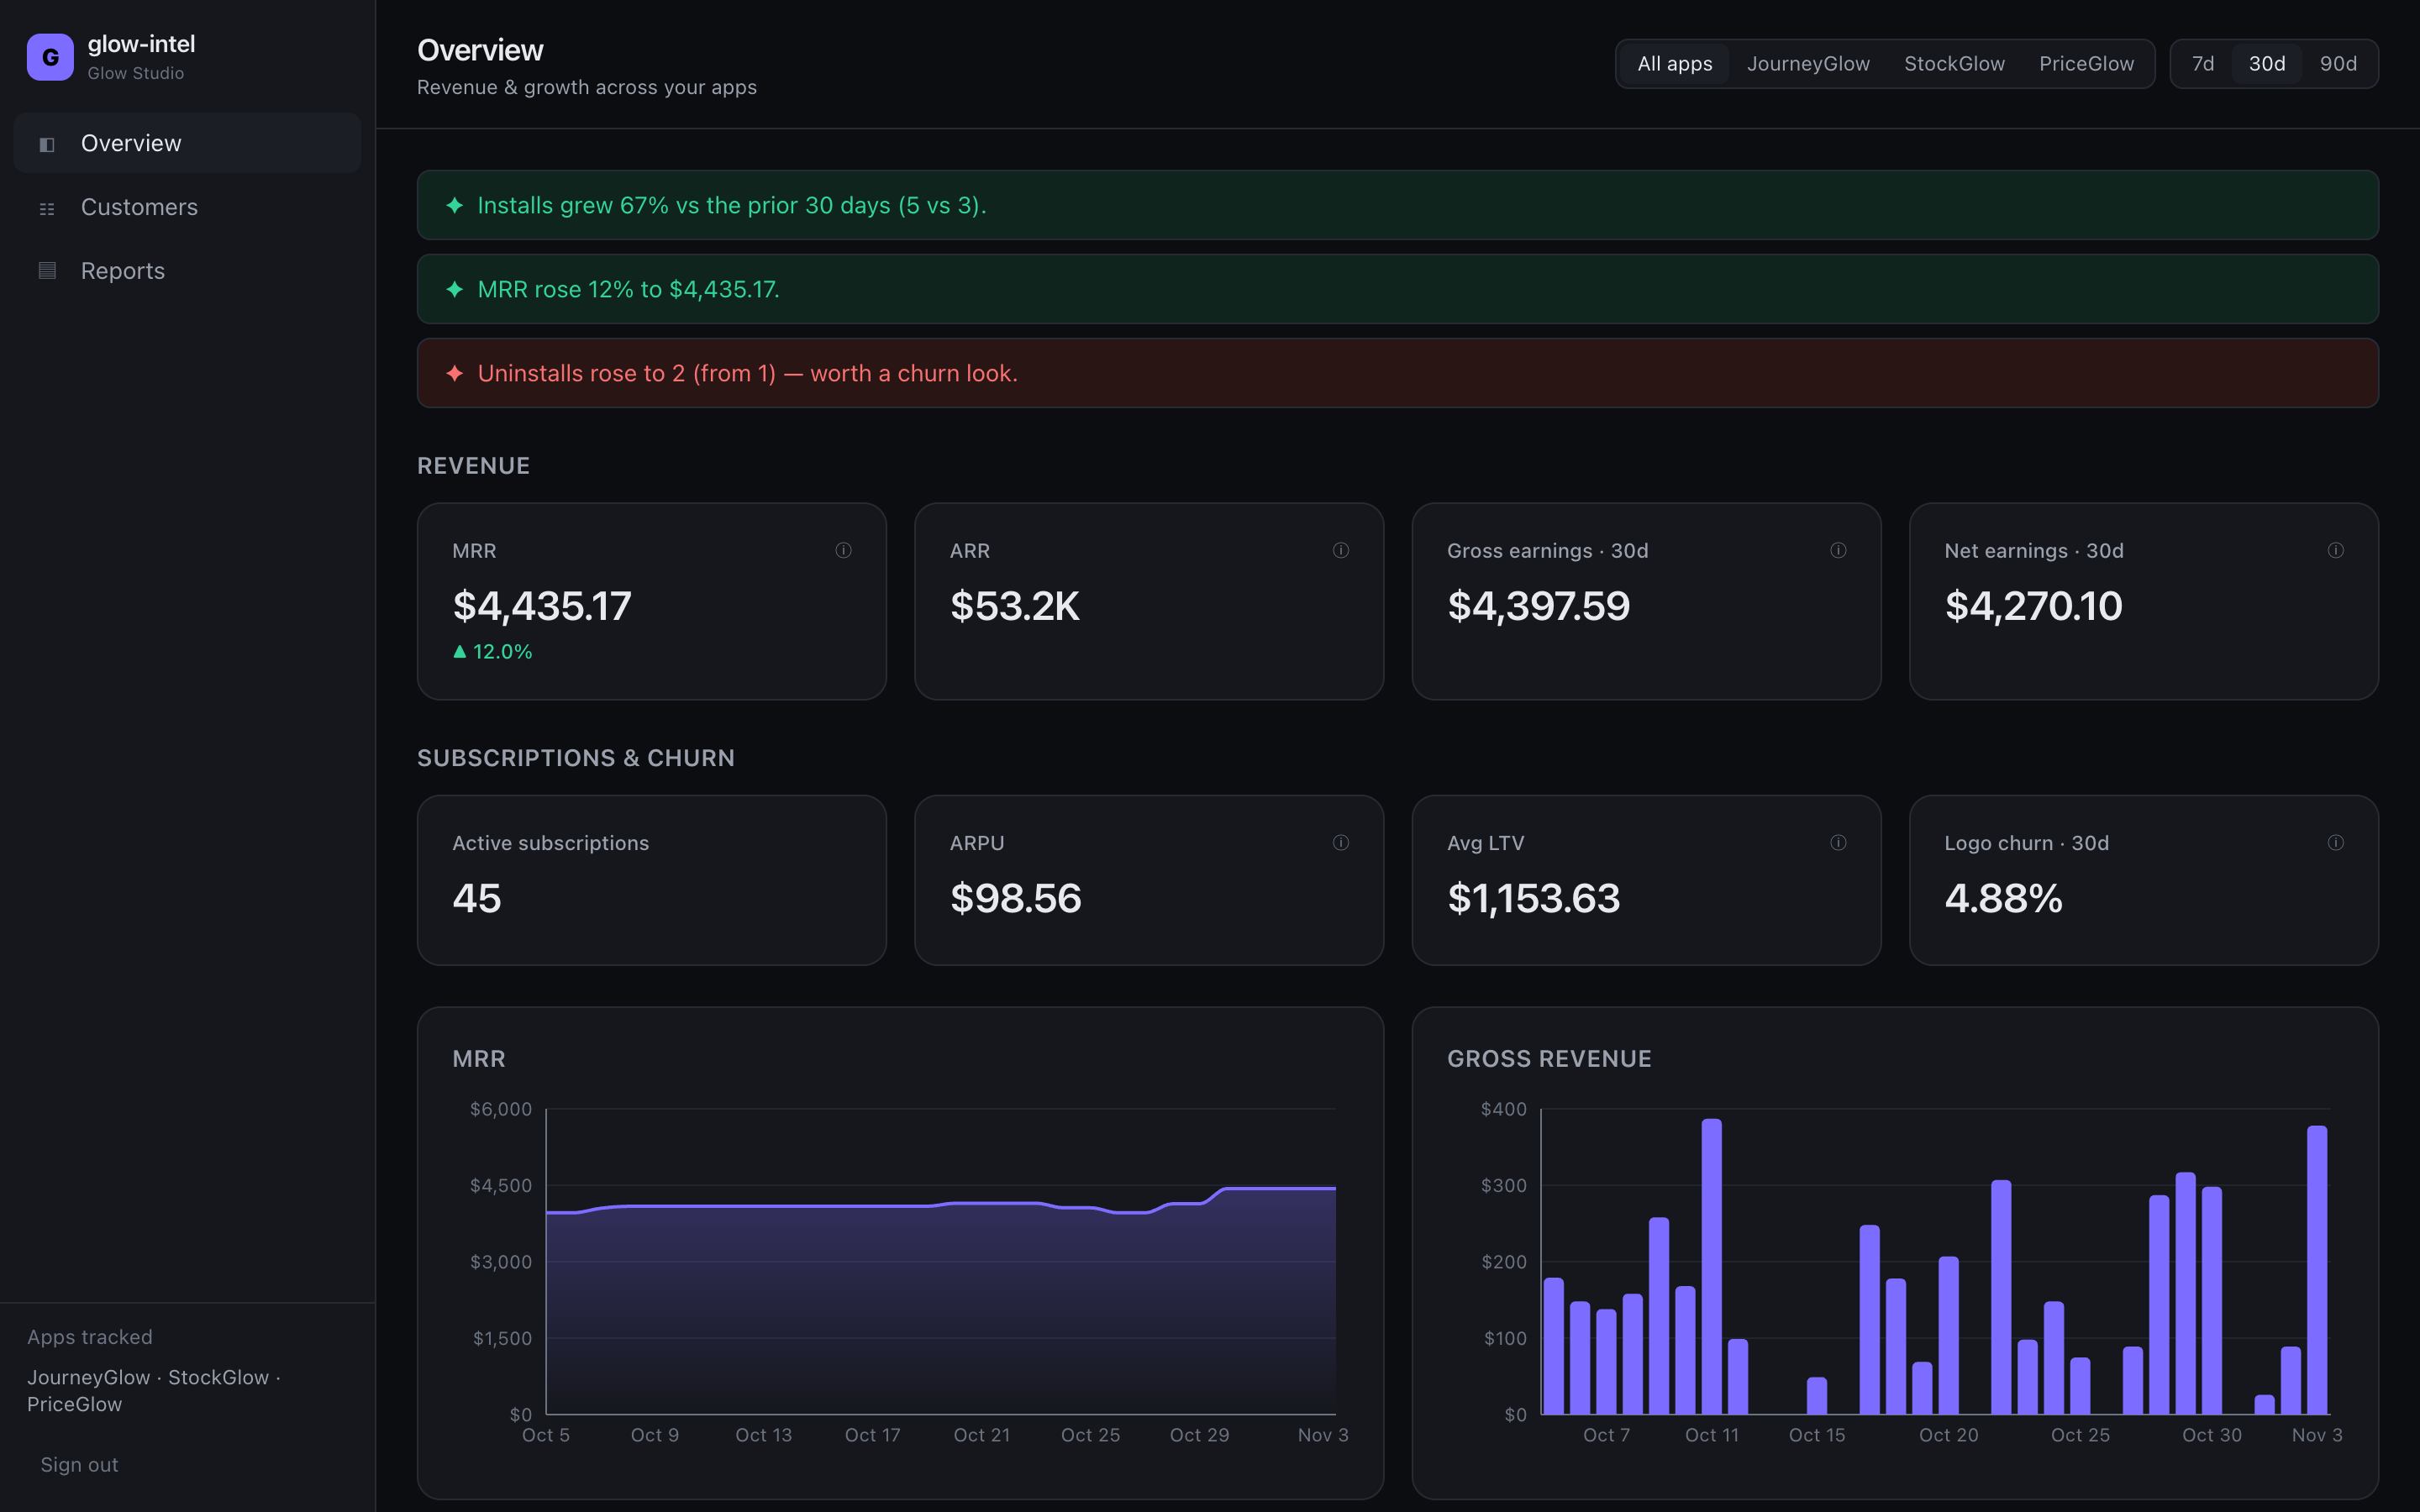
MRR · all apps · 30 days
Fixture data
12% on the prior 30 days
- ARR
- $53.2K
- Active subscriptions
- 45
- ARPU
- $98.56
- Logo churn
- 4.88%
Contents
Six sections, seven figures.
- 01Revenue, closed every dayFig. 1–3
- 02Churn and cohortsFig. 4
- 03The merchant ledgerFig. 5–7
- 04Method: token, apps, ledgerThree steps
- 05A note on leavingCSV, every plan
- 06Schedule of ratesFrom $0
Revenue
The month, closed every day.
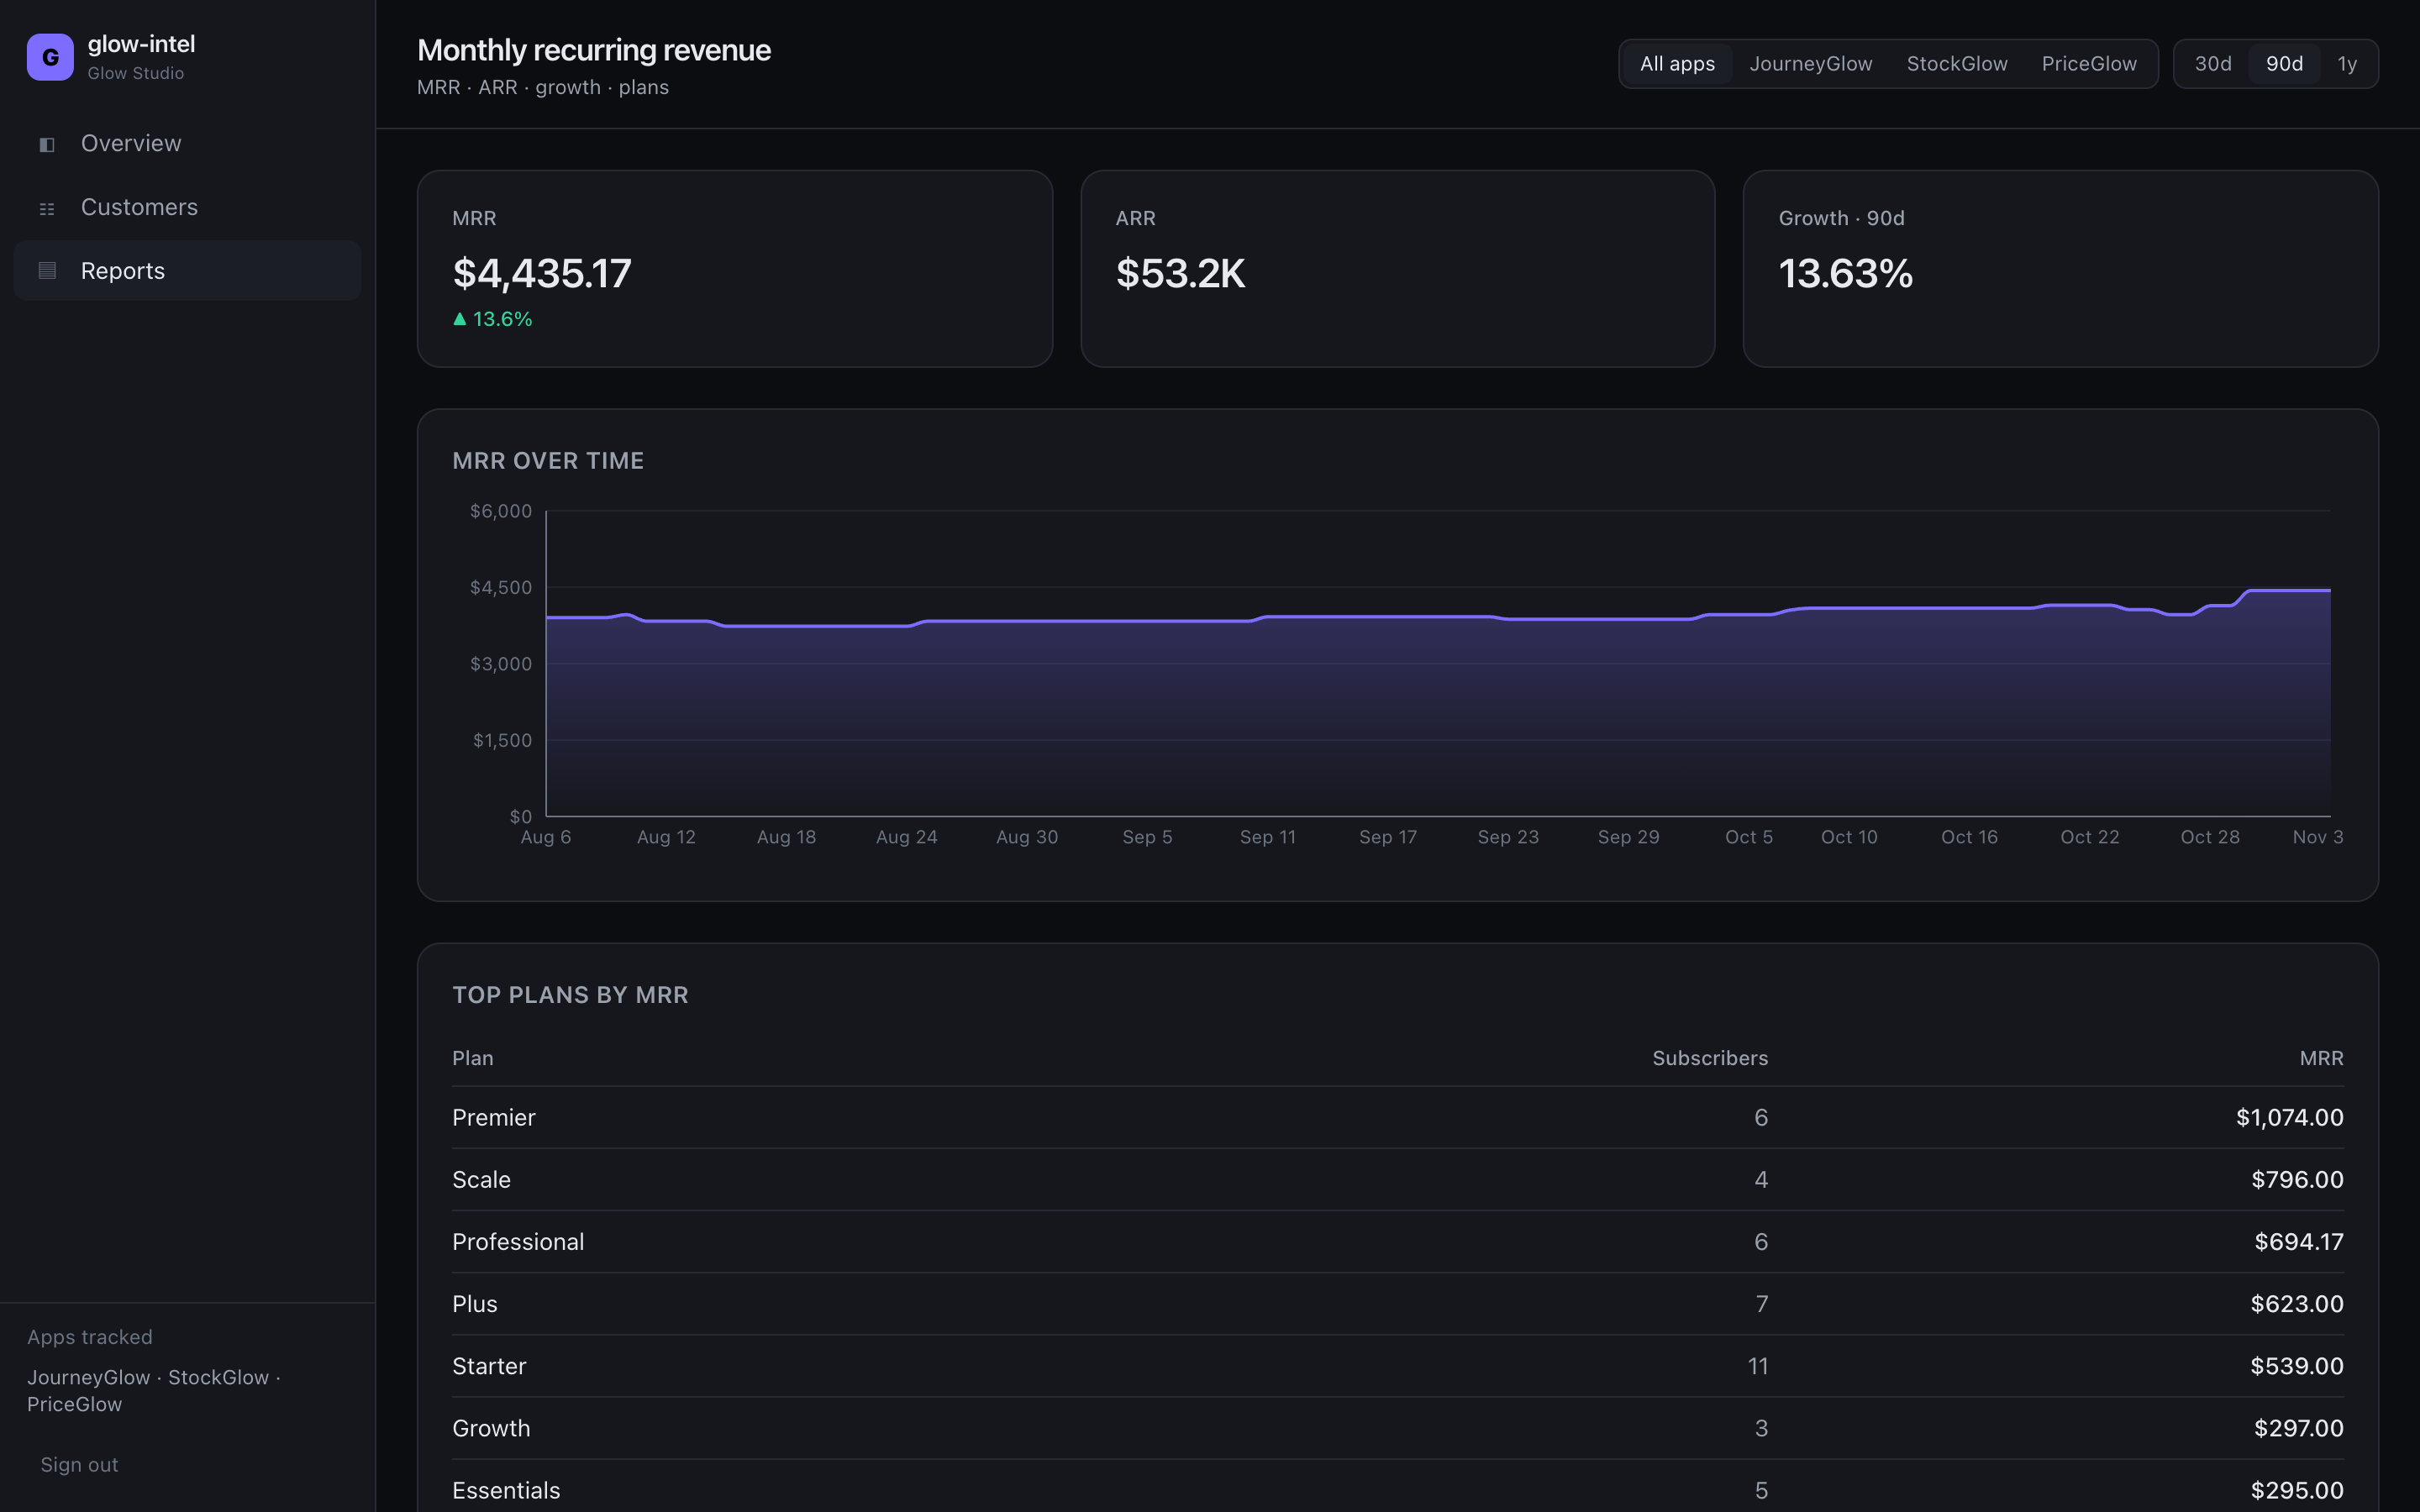
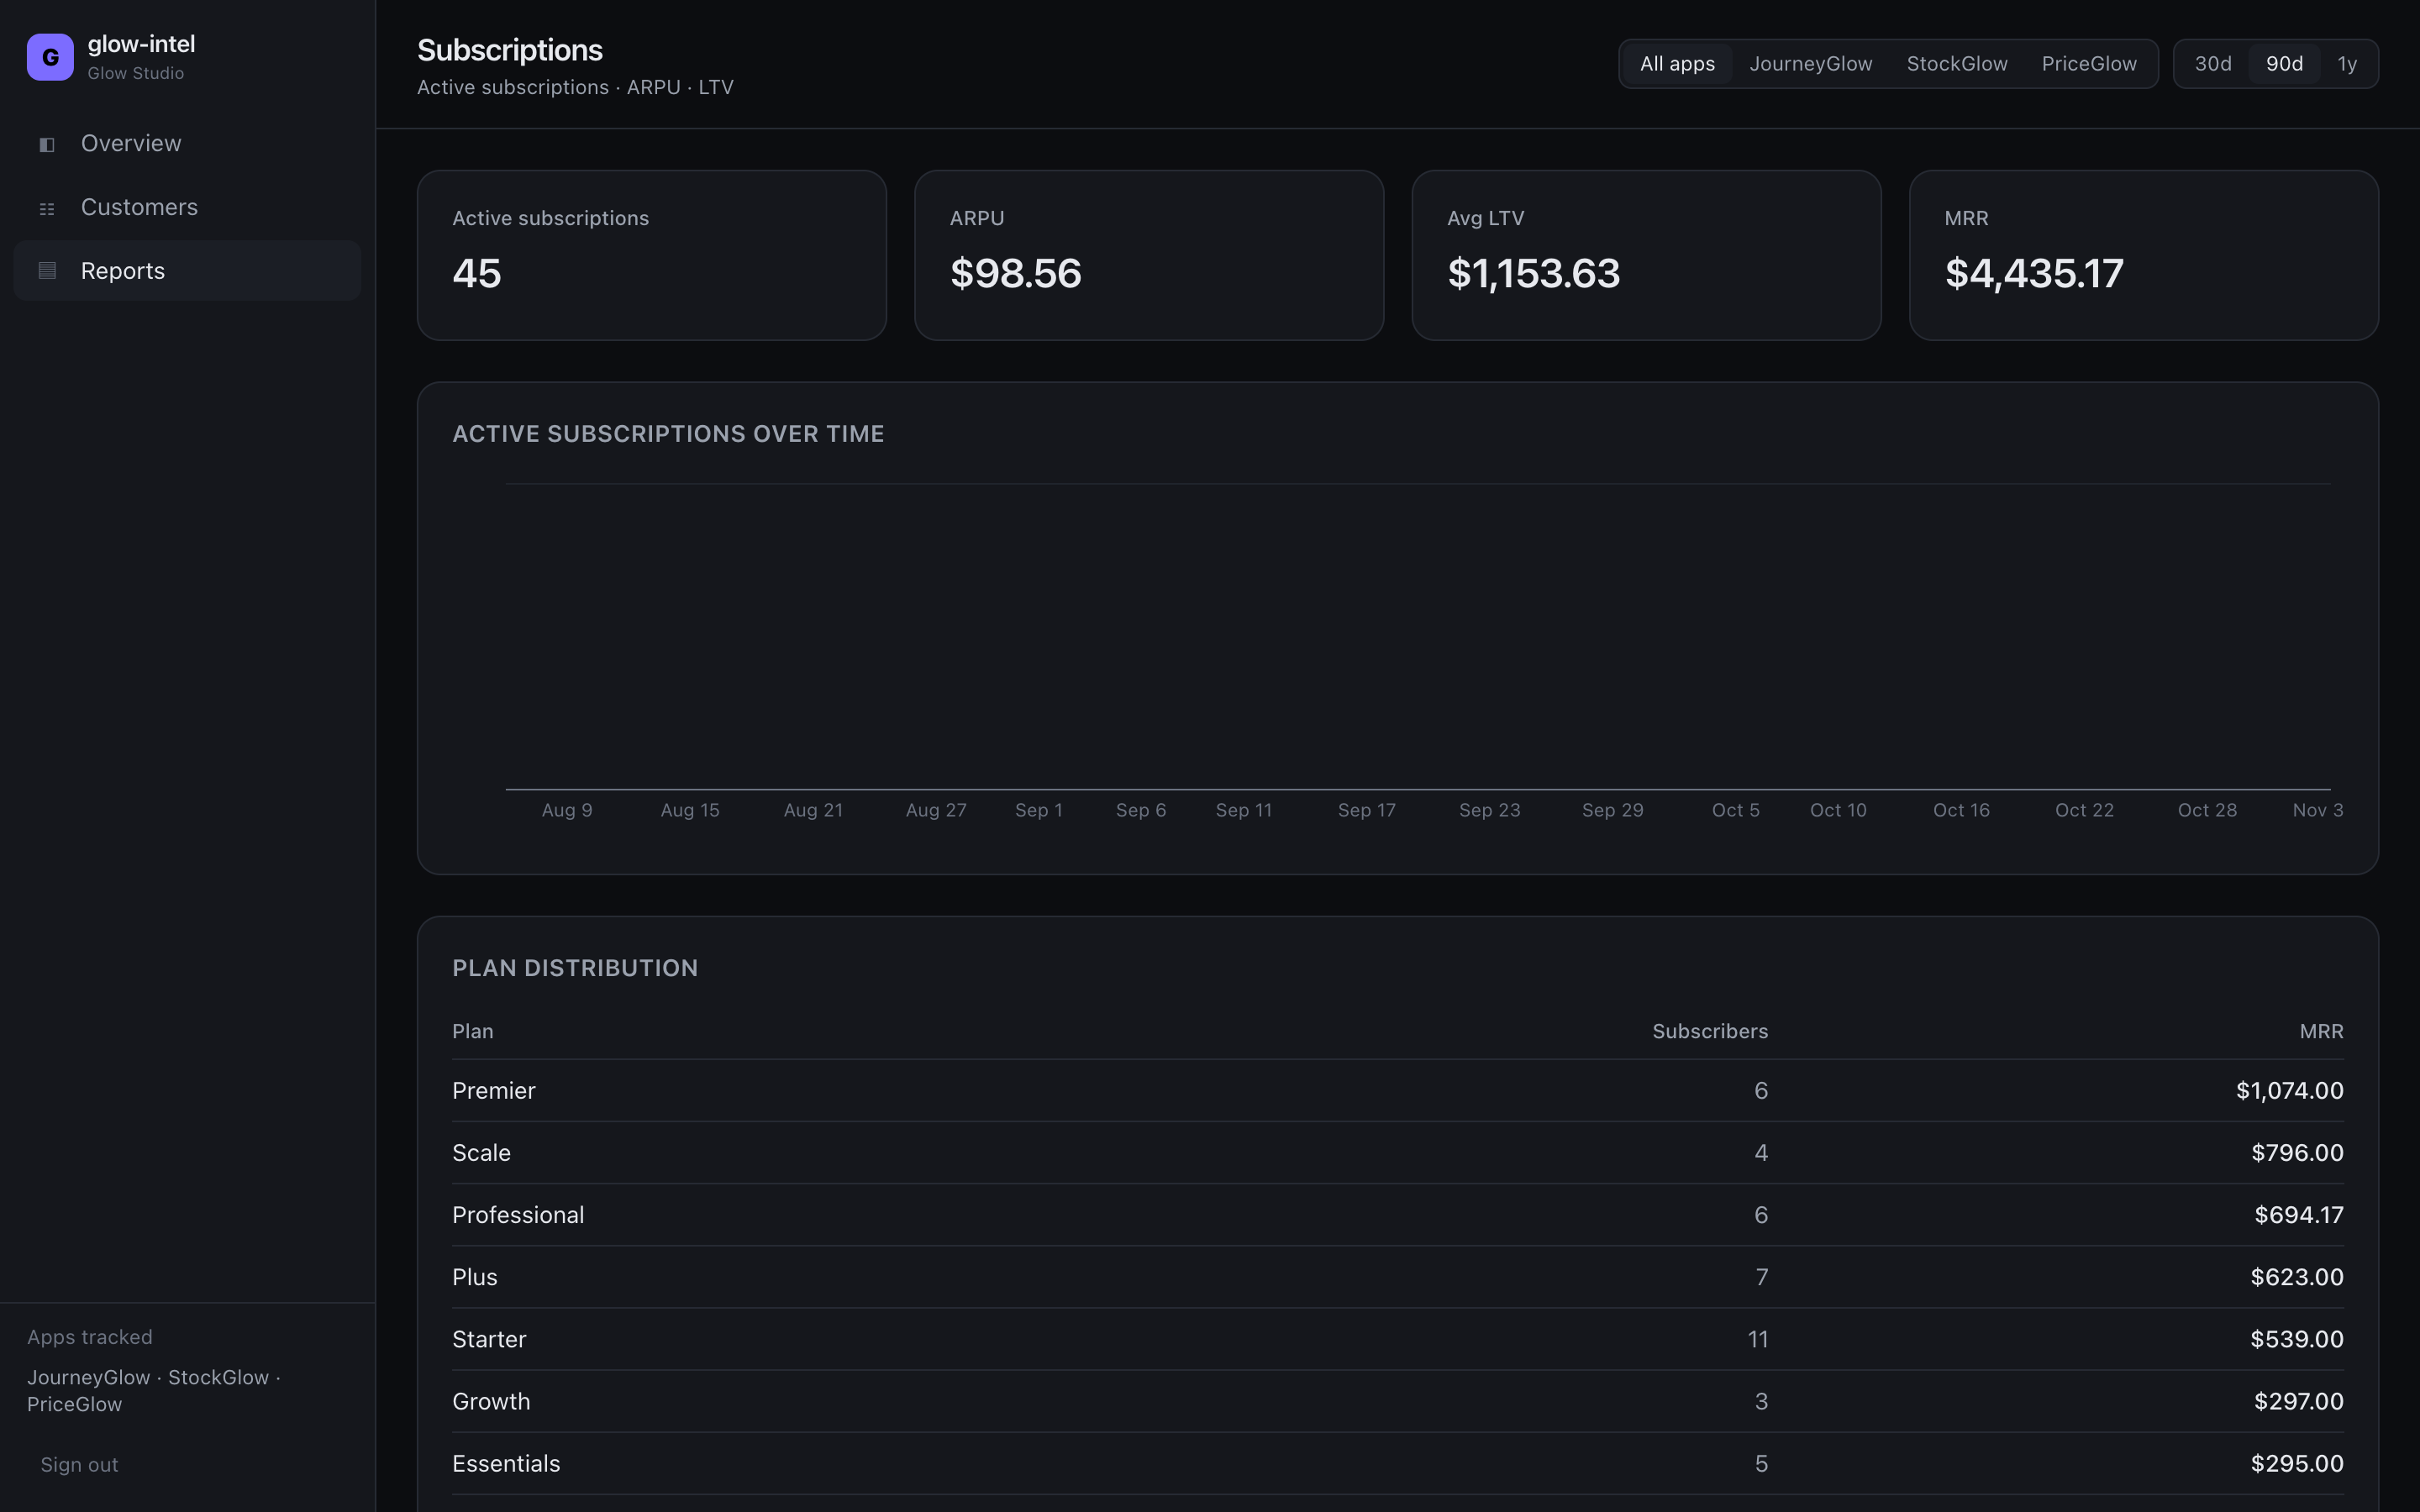
MRR, ARR, net earnings, active subscriptions, ARPU, lifetime value and logo churn, computed from the charges Shopify actually recorded rather than estimated from installs. Earnings reconciles gross to net after Shopify’s fees.
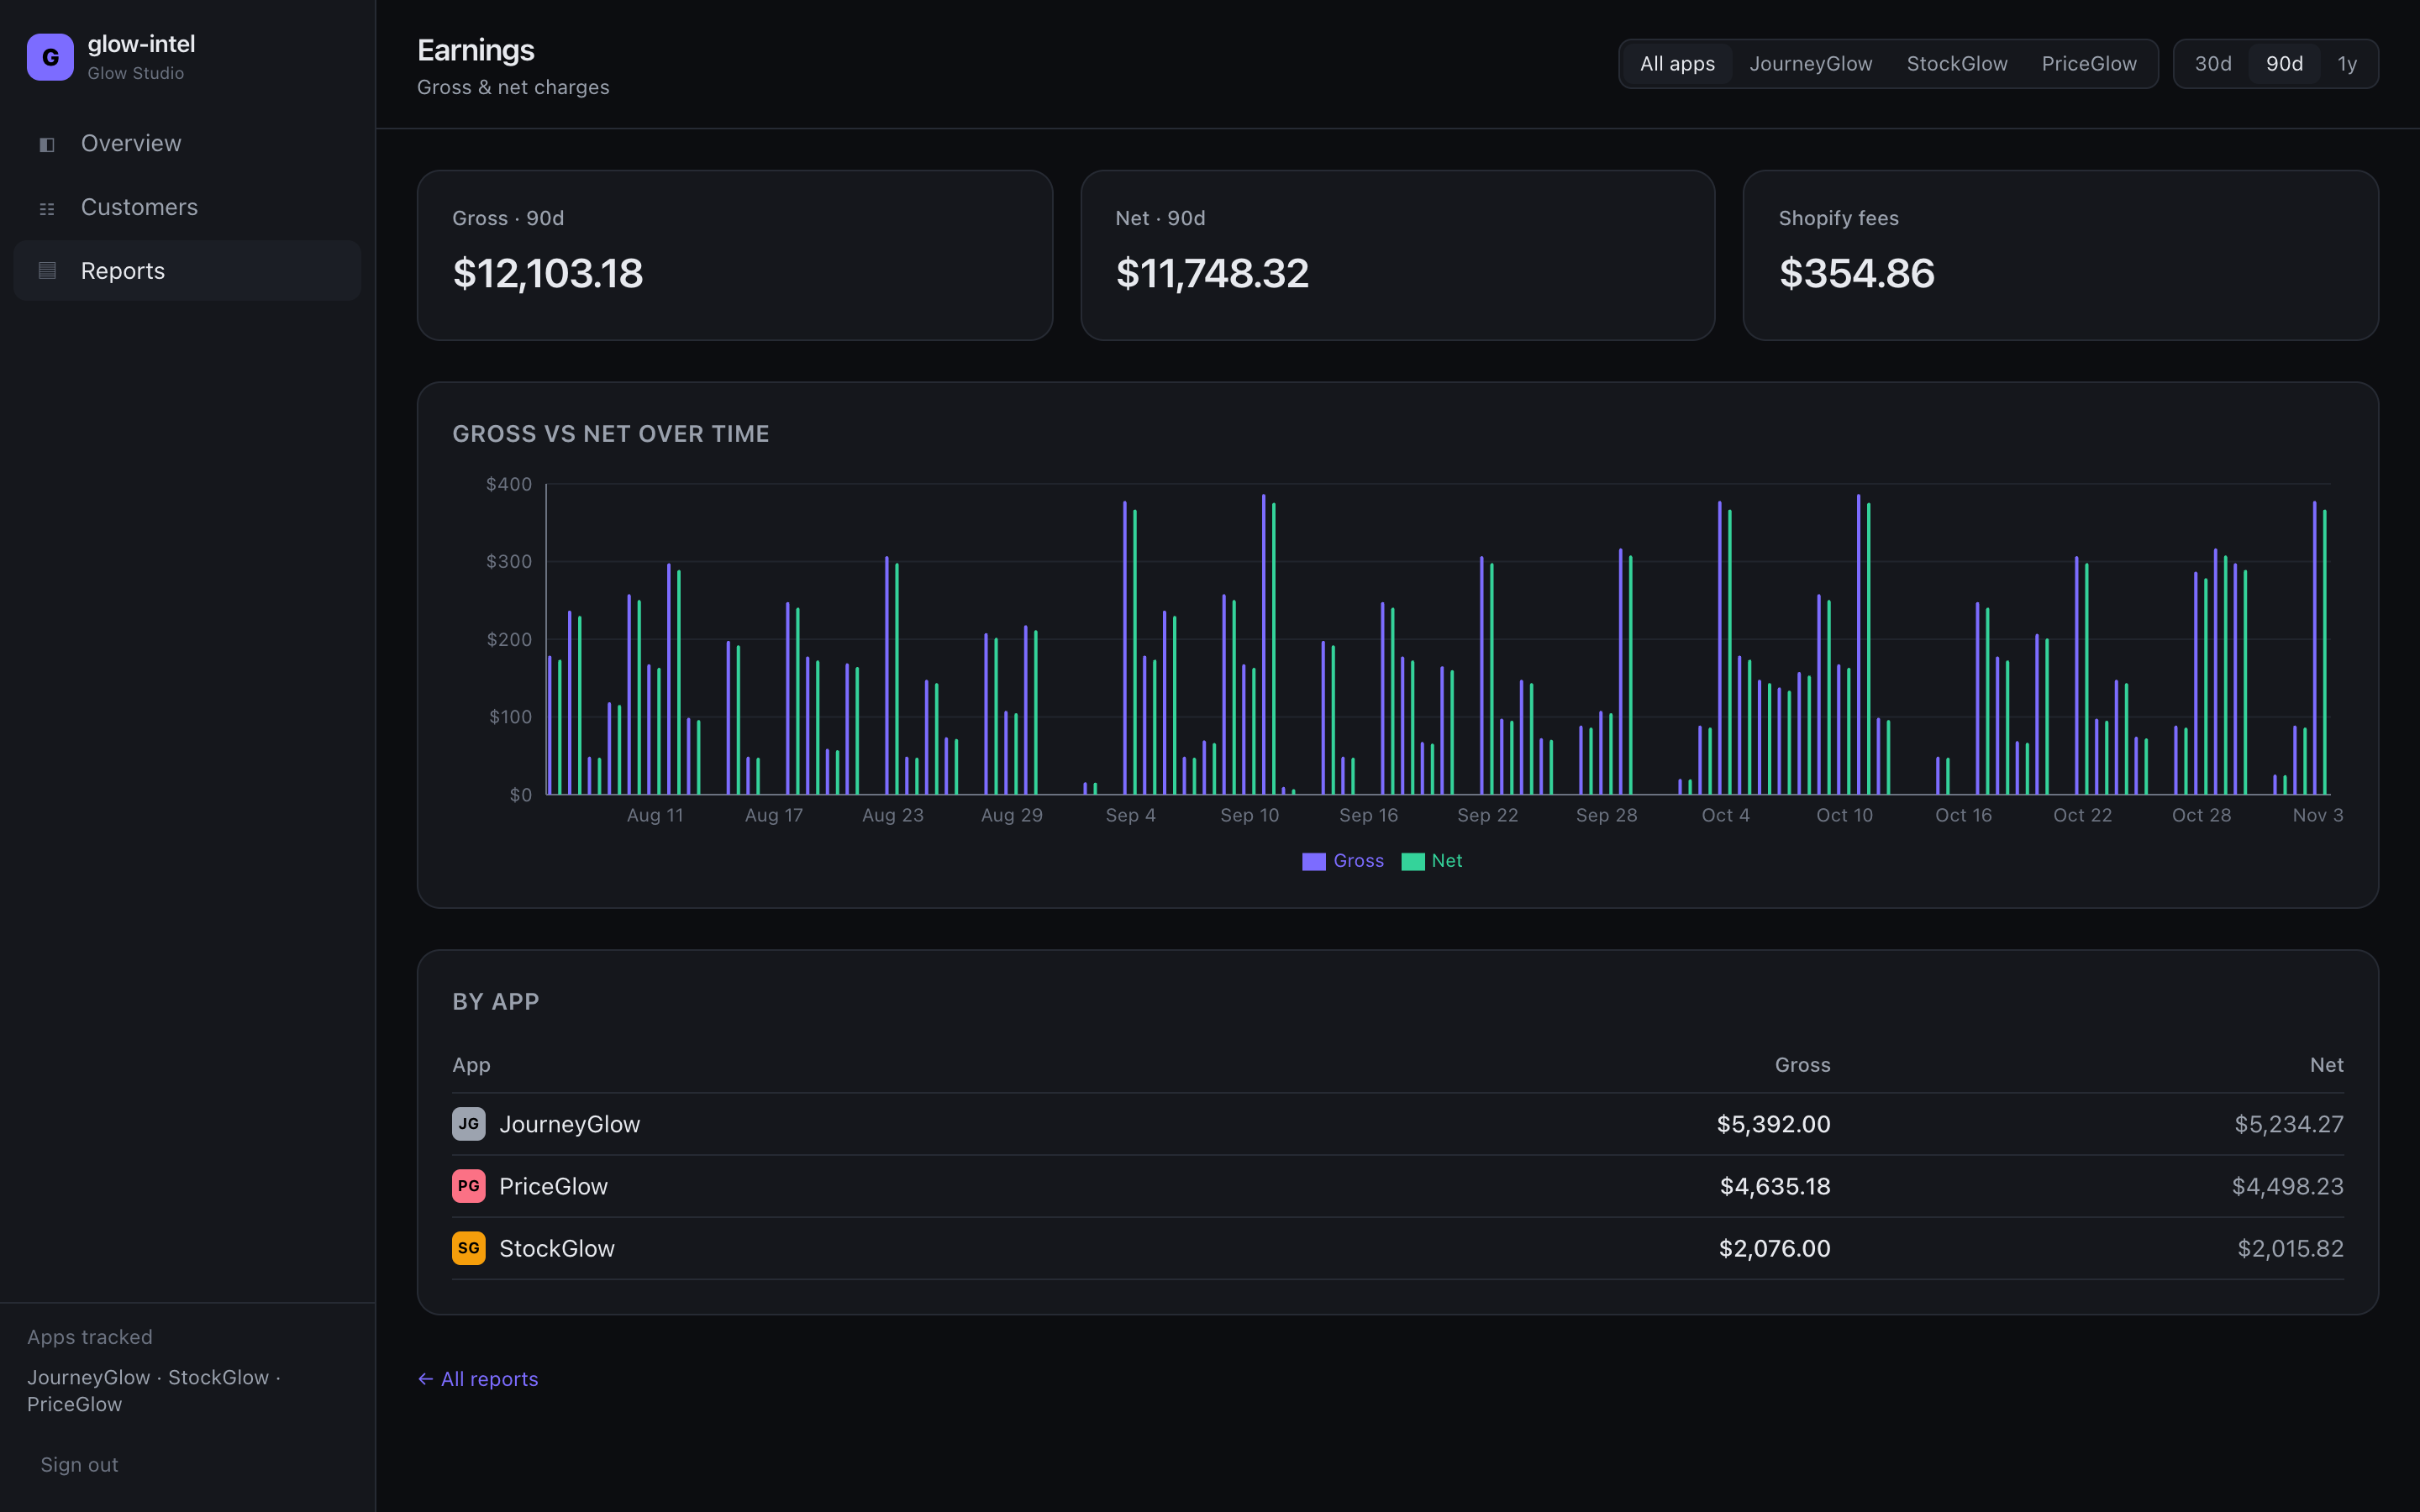
From Fig. 3
Ninety days, all apps.
- Gross revenue
- $12,103.18
- Shopify fees
- −$354.86
- Net earnings
- $11,748.32
Every figure on the overview has its own report behind it. Filter to a single app or read the total, over 7, 30 or 90 days.
Churn & cohorts
Who stays, by the month they arrived.
Cohorts group merchants by install month and follow their retention forward, so a bad quarter shows as a row, not a rumour. Logo churn is reported for the period you pick, and every shop carries a churn-risk score drawn from its billing signals: a stalled billing cycle, a frozen or declined charge, a downgrade, an install of 30 days that has never paid.
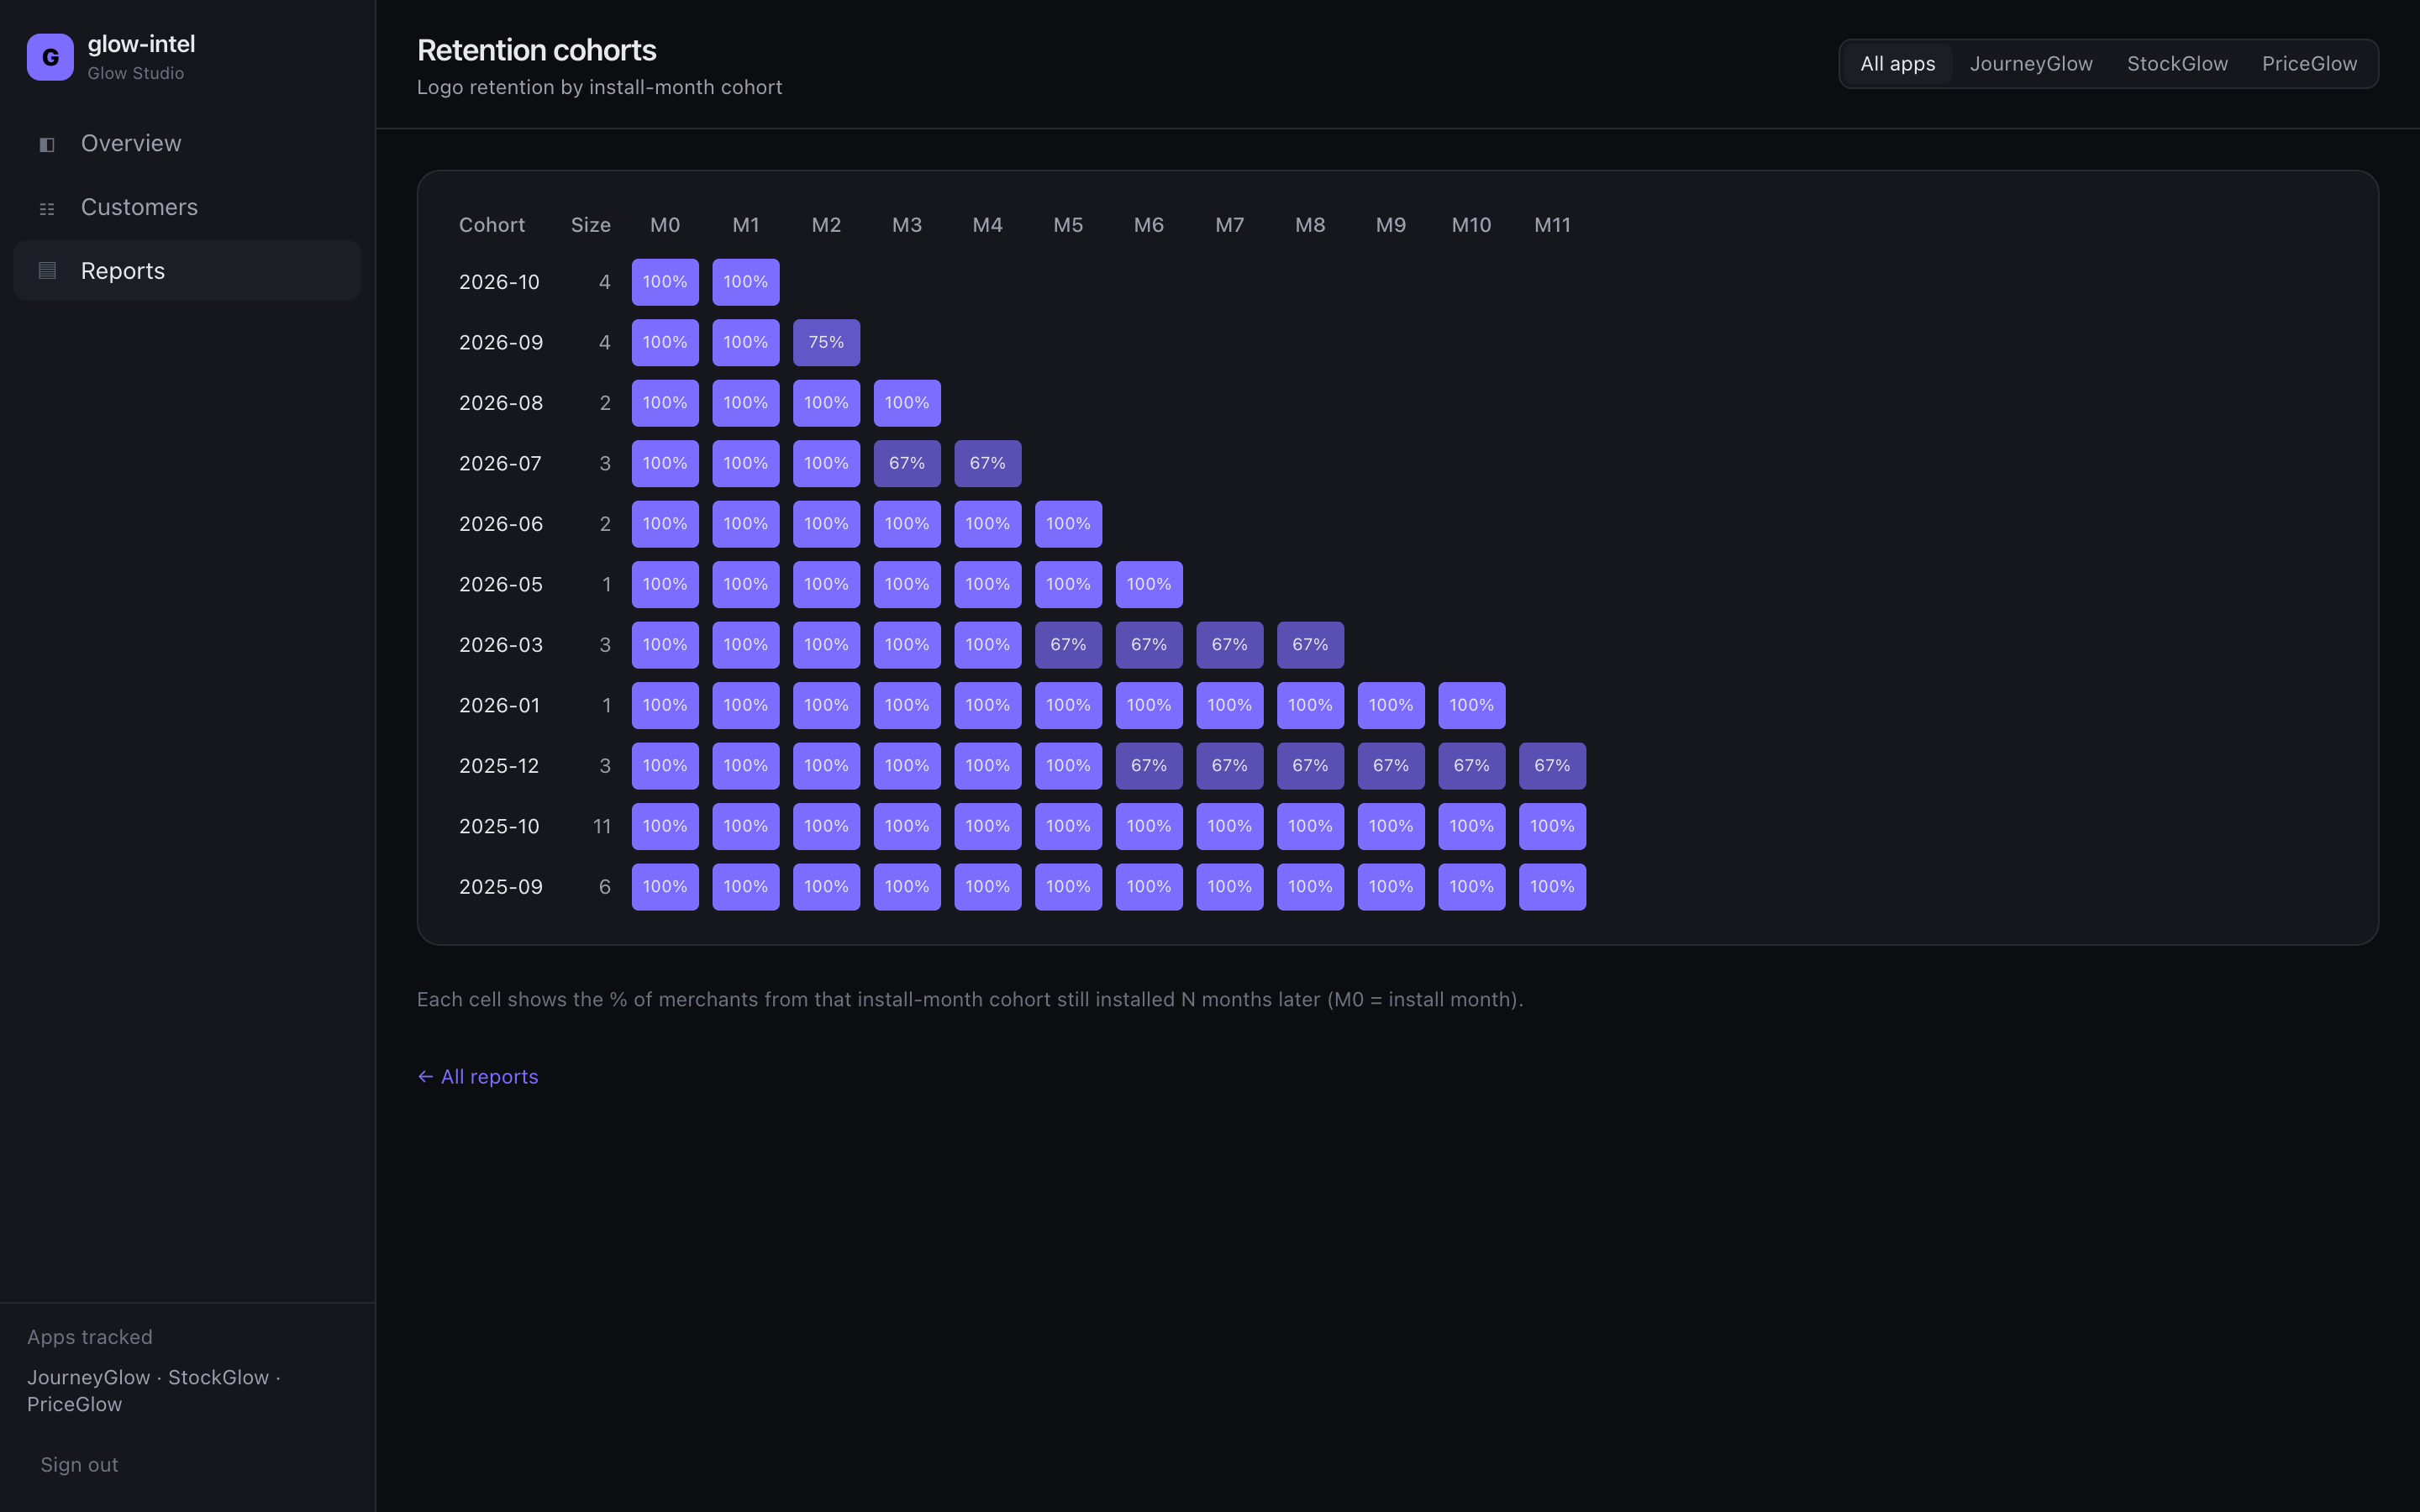
Logo churn · 30 days
The share of subscribing shops that uninstalled in the period. Churn risk is scored low, medium or high per shop. Alerts by email or Slack, when a shop’s billing stalls or a charge is frozen, declined or downgraded, are coming to Studio and above.
The merchant ledger
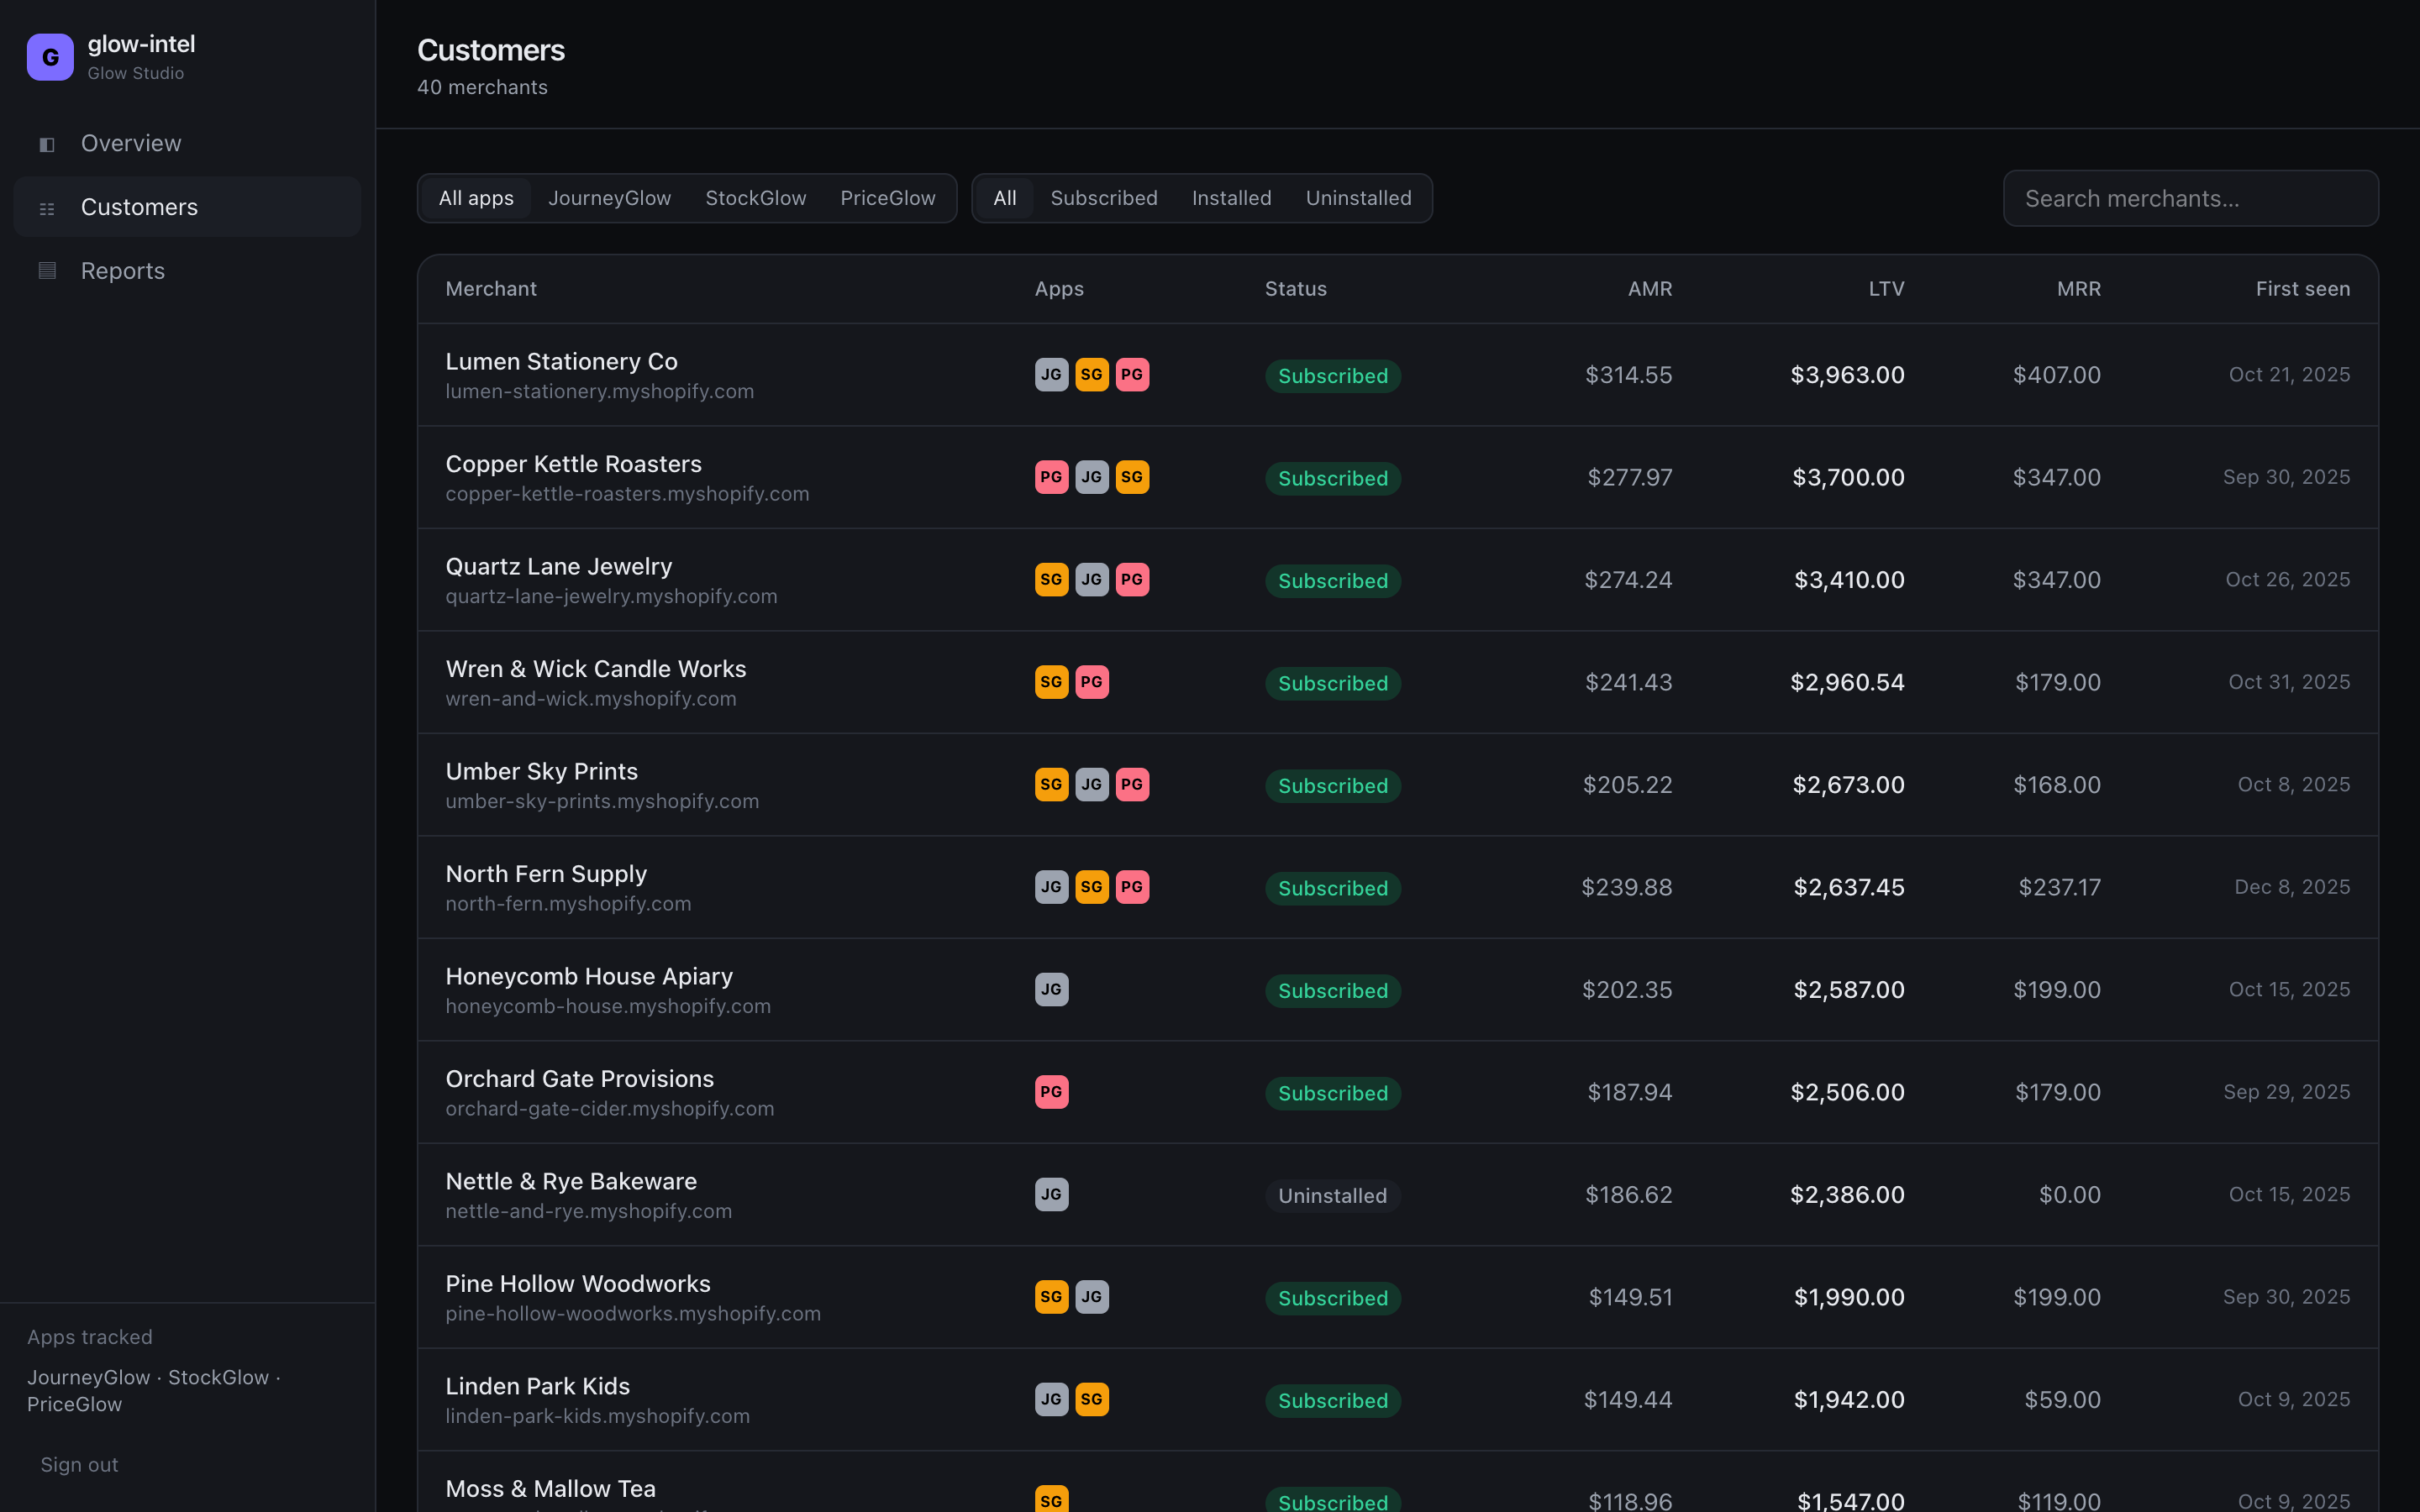
Every merchant, on one page.
Open any shop and read which of your apps it runs, on which plan, what it has paid you over its lifetime, and its churn-risk score. Beneath that, its timeline across all your apps at once: the latest 100 installs and uninstalls, charges and plan changes, within your plan’s history window.
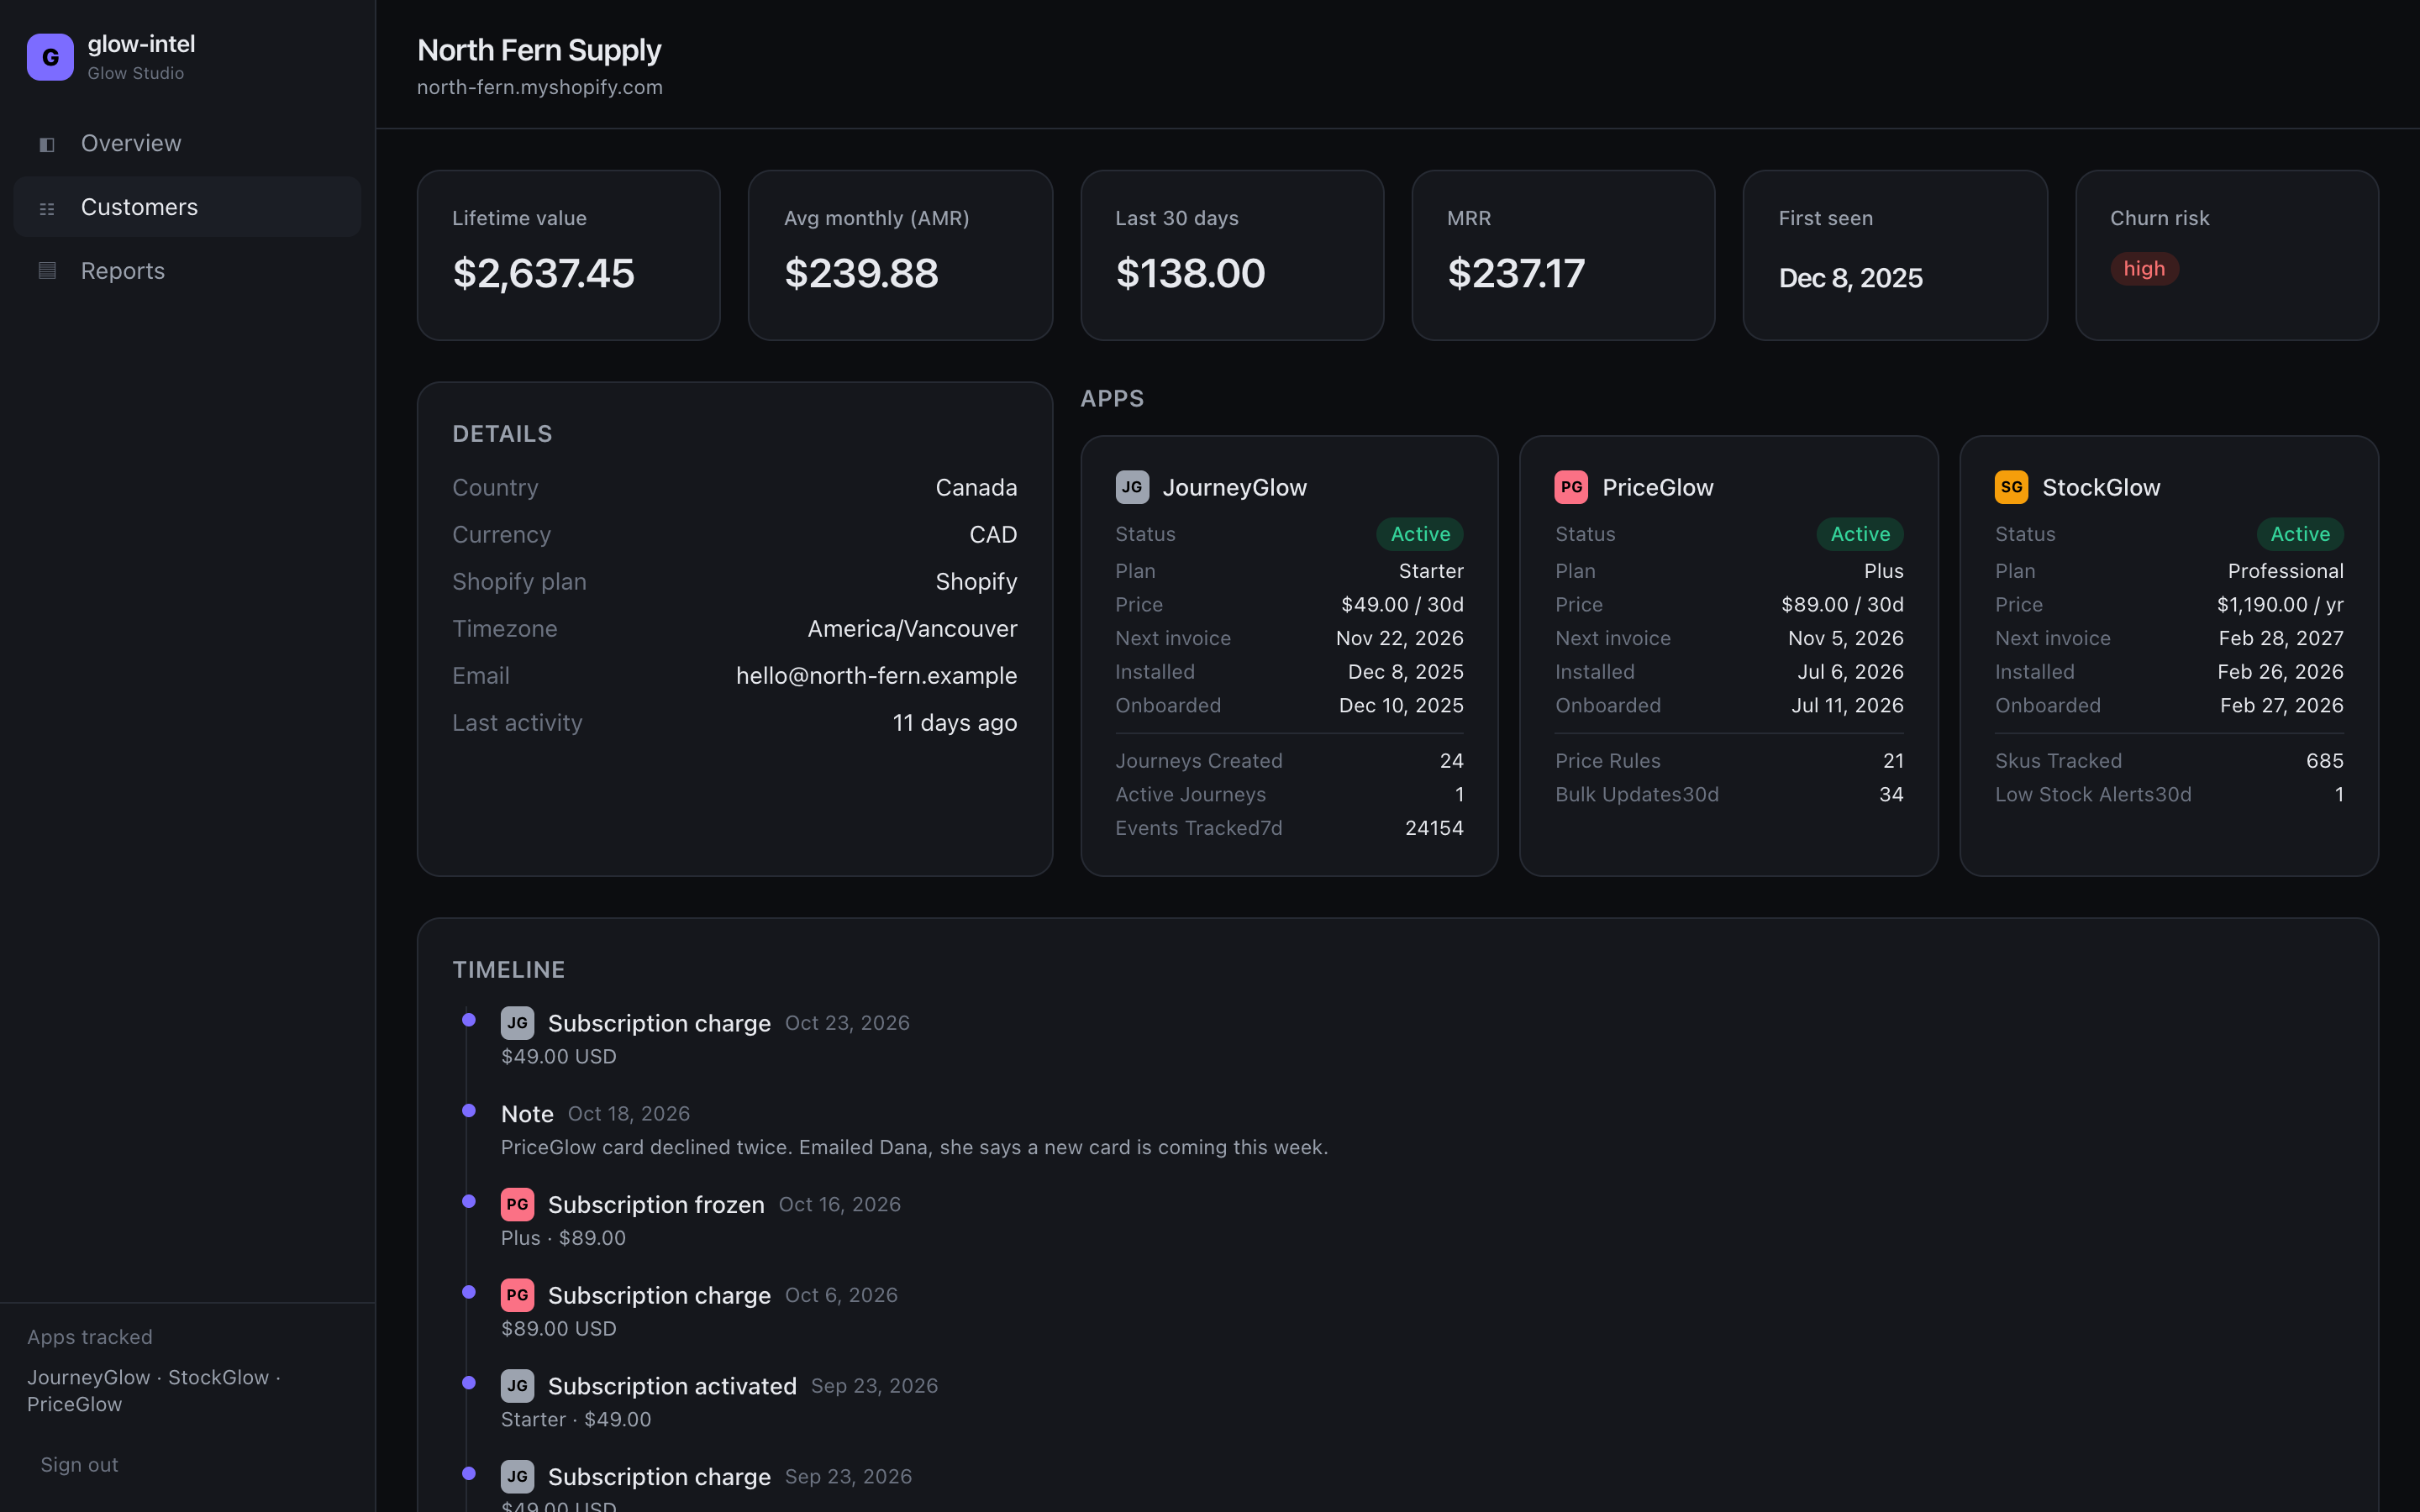
north-fern-supply.myshopify.com
- Lifetime value
- $2,637.45
- MRR
- $237.17
- Apps running
- 3
- Churn risk
- High
A shop on three of your apps at once is worth knowing about. A cross-app overlap view is coming to Studio and above.
Method
Three steps. No snippet, no SDK, no migration.
- 1
Paste a Partner API token
Create an API client in your Shopify Partner Dashboard and paste its token. We use it only to read your apps, app events and transactions. We never send Shopify a write, and you can revoke the token there at any time.
- 2
Pick your apps
Choose which published apps to track. One on Spark, three on Solo, ten on Studio, as many as you like on Portfolio. To change them later, email us.
- 3
Read the ledger
The first sync backfills your full history from Shopify’s own records, on every plan. After that it runs daily on Spark and Solo, hourly on Studio and Portfolio. Your merchants’ stores are never touched.
A note on leaving
Mantle shut down its analytics product in 2026. Your numbers should never depend on someone else’s roadmap.
On every plan, including the free one, your data exports as CSV whenever you ask, with full history. Leave with the raw records and the daily metrics we computed from them, the day you decide to.
- TransactionsCSV
- Subscription eventsCSV
- MerchantsCSV
- Merchant-app installsCSV
- Daily metricsCSV
- NotesCSV
Priced per app, never a cut of your revenue. No tracking snippet runs in your app or in your merchants’ stores.
Schedule of rates
Priced by the number of apps, never by your revenue.
Your bill does not grow because a merchant upgraded. Pay for how many apps you track and how many people read the ledger. Every report is on every plan. Annual billing is ten months’ price.
Spark
$01 app · under $5K MRR · 90 days in view · daily sync
Solo
$19/ mo3 apps · 1 seat · unlimited history · $190 a year
Studio
$49/ mo10 apps · 3 seats · hourly sync · $490 a year
Portfolio
$99/ moUnlimited apps · 10 seats · hourly sync · $990 a year
Get your numbers on the record this afternoon.
Paid plans open by request for now: tell us your plan and how many apps, and we’ll email you back. No credit card.